 Statistics may sound dry, but in psychology, it becomes the language through which researchers describe human behavior. Every time a psychologist collects survey responses, records reaction times, or measures stress levels, the raw numbers by themselves are confusing. Descriptive statistics step in to organize and simplify those numbers so they make sense. Instead of staring at hundreds of individual responses, a researcher can say, “The average stress score of the group was 6 out of 10.”
Descriptive statistics are the very first tool psychologists use to see patterns. They do not make predictions or test theories—that job belongs to inferential statistics. Instead, they summarize what is already there, turning chaos into clarity. Whether you are a psychology student, a teacher, or someone simply curious about human behavior, understanding descriptive statistics is essential. They help us see what is typical, what varies, and how groups of people compare.
This article will explain what descriptive statistics are, why they matter in psychology, the four main types, examples from real life, and their limitations. By the end, you will understand how psychologists transform messy data into meaningful insights.
What is Descriptive Statistics in Psychology?
Descriptive statistics are methods used to summarize, organize, and present data in a way that is easy to understand. Instead of analyzing each participant’s score individually, psychologists use these tools to describe the overall picture. For example, in a survey of 200 university students about their daily sleep, descriptive statistics could tell us the average sleep hours, the most common sleep duration, and how much variation exists between students.
At its core, descriptive statistics answers simple but vital questions:
What is typical? (average behavior or result)
How much do people differ? (spread or variability)
How are the results distributed? (patterns, peaks, clusters)
Where does a person or group stand in comparison? (percentiles, quartiles)
Psychologists often deal with large amounts of data. Imagine testing 500 children for attention span. Without summarizing, it would be impossible to see whether most children have short, average, or long attention spans. Descriptive statistics reduce this burden by giving a snapshot of the group in numbers, charts, or graphs.
Why Descriptive Statistics Matter in Psychology
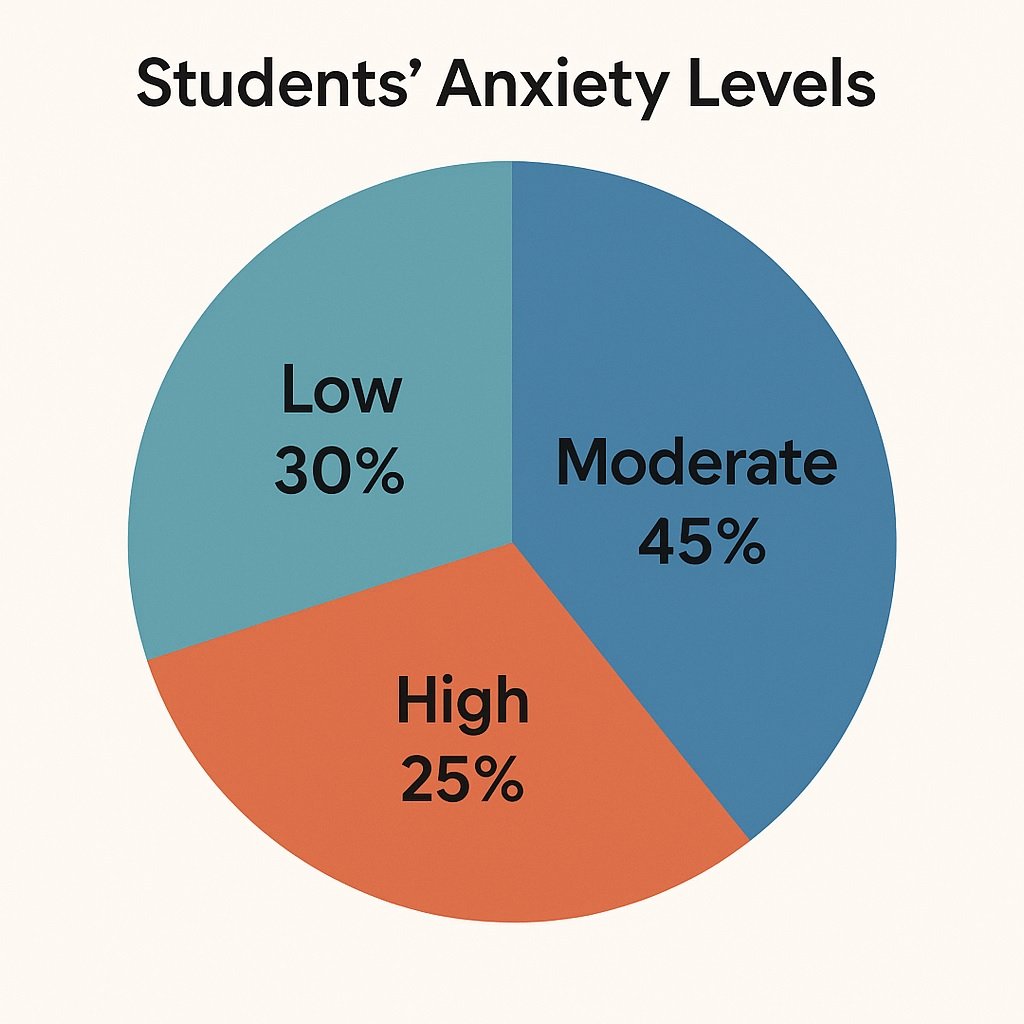
Psychology is about people, and people are diverse. No two individuals respond in exactly the same way. If a psychologist wants to measure anxiety levels before an exam, some students may report “very high,” others “medium,” and a few “low.” Looking at individual responses might give interesting stories, but it does not help identify the overall trend.
Descriptive statistics matter because:
Clarity – They make complex data understandable. A simple average communicates far more effectively than 200 separate scores.
Comparison – They allow psychologists to compare groups (men vs. women, patients vs. healthy controls, young vs. old).
Communication – Research findings can be shared with other psychologists, teachers, parents, or even policymakers in a clear format.
Foundation – They are the first step before deeper analysis. Without summarizing, you cannot move on to testing hypotheses.
In real-world practice, descriptive statistics are everywhere in psychology:
A school counselor summarizes test results of a class.
A clinical psychologist tracks changes in a patient’s mood scores over weeks.
A social psychologist reports survey trends on cultural attitudes.
These numbers are not just academic—they guide treatment decisions, educational policies, and social awareness.
The Four Types of Descriptive Statistics
Psychologists generally use four broad types of descriptive statistics. Each answers a different question about the data.
Measures of Central Tendency
These statistics show what is “typical” in a dataset. The three main measures are:
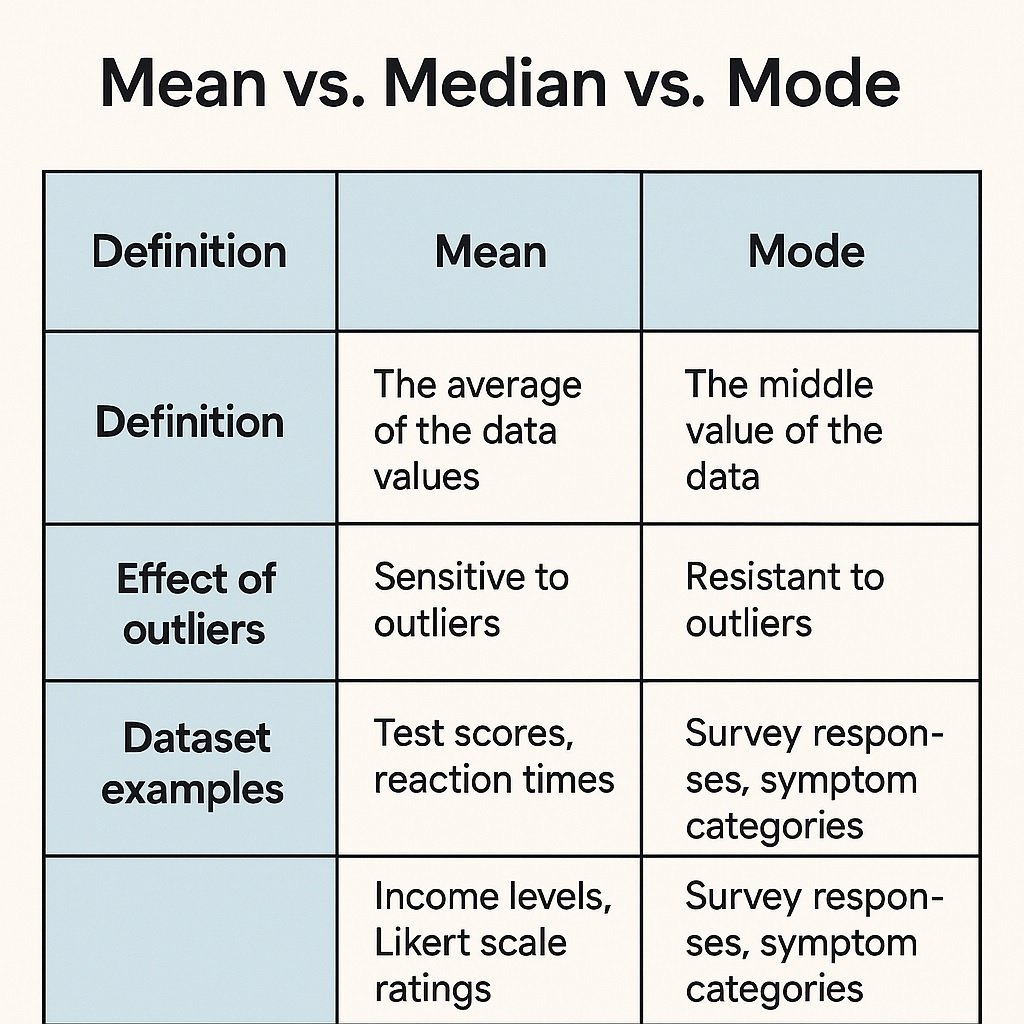
Mean (average): Add up all scores and divide by the number of participants.
Example: In a depression scale given to 100 patients, if the average score is 14, psychologists can say, “On average, depression severity is mild.”Median (middle value): Arrange scores in order and take the middle one.
Example: If half of the students scored above 70 in an exam and half below, the median is 70, regardless of extreme high or low scores.Mode (most frequent value): The score that occurs most often.
Example: If most children in a survey report sleeping 8 hours, then 8 is the mode.
Central tendency helps psychologists talk about the “typical” person in a group, even when individuals vary widely.
Measures of Variability
While central tendency tells us what is typical, variability explains how much people differ. Psychologists need both to get a full picture.
Range: Difference between the highest and lowest score.
Example: In an anxiety test, if scores range from 5 to 45, the range is 40.Variance: Average squared differences from the mean. It shows how spread out the data is.
Standard Deviation (SD): The most useful measure, showing how much scores deviate from the mean.
Example: If the average stress score is 20 with an SD of 2, most people fall between 18 and 22. If the SD were 10, people’s stress levels would be much more varied.
In psychology, variability matters because it reveals diversity. Two groups may have the same mean anxiety score, but one group may have very consistent responses while another shows extreme highs and lows.
Frequency Distributions
This type shows how often each score occurs, usually presented as tables, bar charts, or histograms. It answers: What pattern does the data follow?
A histogram could show that most teenagers report moderate stress, with fewer at the extremes of very low or very high stress.
A bar chart might illustrate how many people fall into “low,” “medium,” or “high” categories of emotional intelligence.
A frequency table can quickly summarize large datasets.
Frequency distributions are especially useful in psychology surveys. For example, a survey on social media use might reveal that 60% of students spend 3–4 hours daily, while 20% spend more than 6 hours.
Measures of Position
These statistics describe where a score falls in relation to others.
Percentiles: Show the percentage of scores below a given value.
Example: If a child’s IQ score is at the 90th percentile, they scored better than 90% of children in the sample.Quartiles: Divide data into four equal parts, helping identify middle ranges and extremes.
Psychologists rely heavily on these in standardized testing. Percentiles are crucial for interpreting IQ tests, aptitude tests, or personality scales. Parents often hear percentile scores when receiving their child’s educational assessments.
Descriptive vs. Inferential Statistics in Psychology
While both are part of statistics, their purposes differ:
Descriptive statistics summarize and describe what the data shows.
Inferential statistics use the data to make predictions, generalizations, or test hypotheses.
For example:
Descriptive: “The average depression score in our sample is 12.”
Inferential: “Based on this sample, we predict that the average depression score in the population is between 11 and 13.”
In short, descriptive statistics tell the story of the data you already have. Inferential statistics extend that story to the larger world.
Examples of Descriptive Statistics in Real Life
Descriptive statistics are not just for labs—they shape everyday psychology practice.
Educational Psychology: A teacher calculates the average math score of her class. This helps her identify if the class, overall, needs extra practice.
Clinical Psychology: A therapist tracks the mood scores of a patient across 12 sessions and summarizes progress with an average.
Health Psychology: A survey reports that 65% of participants experience moderate stress.
Social Psychology: Researchers present the percentage of people who agree with a statement about social norms.
Even outside psychology, descriptive statistics are used every day:
News outlets summarize election polls with percentages.
Hospitals report average recovery times.
Fitness apps display your average daily steps.
How Psychologists Use Descriptive Statistics in Research
Descriptive statistics serve multiple roles across psychology fields:
Clinical Psychology – Summarizing symptoms, treatment progress, or test scores. For example, describing how many patients show reduced anxiety after therapy.
Educational Psychology – Reporting student performance on exams or attendance trends.
Developmental Psychology – Describing average ages for milestones like walking or speaking.
Social Psychology – Presenting percentages from surveys on attitudes, prejudice, or group behavior.
Health Psychology – Tracking patterns in diet, sleep, or exercise among populations.
By summarizing the data clearly, psychologists can communicate findings to patients, parents, educators, and policymakers in a way that is easy to act upon.
Limitations of Descriptive Statistics
As powerful as they are, descriptive statistics have limitations:
No explanation of causes – They describe but do not explain why. For example, they may show that students who sleep less also have higher stress, but they cannot prove lack of sleep causes stress.
Risk of oversimplification – Averages can hide important differences. Two classrooms may have the same average score, but one may include struggling students and very high achievers, while the other has everyone performing moderately.
No prediction – Unlike inferential statistics, descriptive statistics cannot predict outcomes or apply results beyond the studied group.
Psychologists always combine descriptive with inferential statistics to get a complete understanding of human behavior.
The Role of Descriptive Statistics in Psychology
Descriptive statistics are the foundation of psychological research. They transform messy data into clear insights. By summarizing what is typical, how much people differ, and where individuals stand, these tools make it possible for psychologists to communicate findings and guide decisions.
Whether it’s a therapist tracking progress, a teacher summarizing test results, or a researcher presenting survey trends, descriptive statistics are always at work. They do not answer “why,” but they provide the crucial first step toward understanding and improving human life.
For psychology students and enthusiasts, mastering descriptive statistics means gaining the ability to read research with clarity and confidence. For professionals, it means being able to present complex findings in a way that truly helps people.
Bottom line: without descriptive statistics, psychology would remain a sea of raw numbers. With them, it becomes a science of meaningful patterns.

M.Phil in Psychology from UET Lahore, Sajid Ali shares clear, research-based insights on mental health, emotions, and social behavior in simple English. Sajid Ali draws on hands-on academic research and real-life observations of emotional and social behavior, turning psychological theory into clear, practical insight for everyday readers.